
Written by: Corey Janoff
This post was originally published on our previous blog website on February 14, 2018 and has since not been revised and/or updated.
If you have been following the financial markets and watching your 401k or other investment accounts lately, you have likely noticed some ups and downs this year. If you haven’t been following the news or watching your portfolio, then good for you. That is probably better for your health in the long run.
For those following their portfolios closely, In January, you were pumped. If you were invested in a diversified portfolio of mutual funds or ETF’s that primarily invest in stocks, there is a good chance your account was up 6-8% that month. That’s a pretty good start to the year. Replicate that over the next eleven months and you would be up 70-100% for the year!
Then February rolled around. I don’t know if Punxsutawney Phil is able to forecast the stock market. If he sees his shadow, does that mean six weeks of winter for stocks? Since the market highs earlier this year, most major stock indices fell by about 10% in a matter of days.
Is that normal? Should I be concerned if my portfolio fell by 10% in a week? If you have a seven-figure account balance, you could have seen hundreds of thousands of dollars in declines. That won’t put a smile on anyone’s face.
Since 2009, we have been pretty spoiled with how our investments have performed. Looking at US-based company stocks, they have pretty much gone straight up for the last nine years. And since 2012 stocks have shown very little volatility, or erratic movement.
In 2017, the largest drop from its high point the S&P 500 saw during the year was a whopping 3%. That is definitely not normal.

Double Digit Declines ARE Normal
For investors that haven’t been investing for more than a handful of years, I have news for you. Fluctuations in stock prices are normal. Very normal. Sometimes they can be rapid and large. Take a look at the table below, put together by JP Morgan. It shows the total return each year for the S&P 500 since 1980, measured by the bars on the graph. The red dots represent the largest decline the S&P 500 experienced during each respective year.
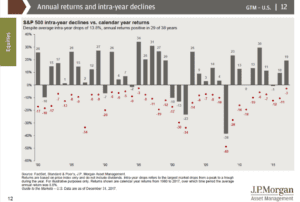
Using the 2017 example from earlier, the S&P 500 went pretty much straight up during the year, ending the year up 19% from where it started in January. However there was a brief stint in the spring where it actually declined by 3% before resuming its steady rise.
Notice anything about this table? Stocks decline in value every single year! Some years are greater than others. The average decline each year is almost 14%! Yet in three out of four years, the S&P 500 ends the year higher than it started the year.
So a ten percent decline is the largest decline we have seen since…2016. You have to reach way back into your memory banks to remember that year. In January of 2016, the S&P 500 fell by 11%. Then it rebounded and ended the year up ten percent. Could we see stocks fall further? Absolutely. Only time will tell. But will that become a problem for you? The answer to that question depends on your personal situation and the goals for your investments.
When Do You Need Your Money?
I have mentioned it before, but I can’t stress it enough. The time horizon of your investment should determine how you invest your money and how you react to events like this.
If you need your money soon, within the next few years, you shouldn’t be investing anywhere near the stock market! If you have your short-term money invested in appropriate asset classes for a short-term time horizon (high quality bonds, CD’s, high interest savings accounts), then a ten percent decline in stocks won’t affect you one bit.
If you are investing for retirement and you are in your 30’s currently, you likely have another 20-30 years before you plan on accessing that money. You have plenty of time to let the investments in your portfolio rebound and recover. You are going to see plenty of these ten percent (or greater!) declines in your portfolio in the years ahead. Get used to it.
If you are approaching retirement or currently retired, remember how you have your portfolios structured. Hopefully you have some money allocated for short-term needs that are invested conservatively (as noted two paragraphs above). That way, these quick gyrations in the stock market won’t affect your short-term needs. You will also need some money earmarked for the decades to come, assuming you plan on living a long and healthy retirement. If you are 65 and plan on living into your 90’s, you have plenty of time to let the investments in the long-term portion of your portfolio rebound and recover. You are going to see plenty of these ten percent (or greater!) declines in your portfolio in the years ahead. Get used to it.

Rebalancing Your Portfolio
If the stock market declines persist, and/or you have a sizeable portfolio, events like these present a good opportunity to rebalance your portfolio back to your target allocation.
For example, let’s pretend you have $1 million in your investment accounts and your desired allocation is 80% stocks and 20% bonds. $800,000 in stocks and $200,000 in bonds. If your stocks decline in value by 15%, you will now have $680,000 in stocks. There is a good chance your bond balance hasn’t changed much, or may have even risen slightly. Let’s pretend it rises by 3%, so now you have $206,000 in bonds. To get back to your target allocation of 80% stocks and 20% bonds, you would sell $29,000 of your bonds and invest that $29,000 in stocks. The resulting portfolio will have $709,000 in stocks and $177,000 in bonds, for a total of $886,000.
You are still down $114,000 from where your peak was, but now you are back to your target allocation. And what usually happens after stocks decline by double-digit percentages? They usually have a growth spurt. If stocks rise by 30% from this point in the coming year or so, your $709,000 stock balance will rise to $921,700. If you didn’t rebalance and left things as is, your $680,000 stock balance will only rise to $884,000. So by rebalancing, you generated an extra $37,700 of wealth, or about 4% more than you would have seen if you left things as is (assuming the bonds stayed flat during that time).
By developing a plan and sticking to it, you remove emotion from the equation. You essentially force yourself to by low and sell high. Sell high and buy low. Getting an extra percent, or two, or four, each year by rebalancing your portfolio can really add up over time. You also want to be sure to rebalance the other way when stocks rise. That can save you a percent or two when the markets go down. Again, that savings can add up over time. A penny saved is a penny earned.
In some cases, minimizing losses can be as beneficial as maximizing gains. We don’t want to get too greedy with our investments. If you experience a 50% loss, you will need a 100% gain to get back to where you were before the loss. If you experience a 20% loss, you need a 25% gain to get back to even. If you experience an 80% loss, like some investors did in the early 2000’s when the internet bubble burst, you need a 400% return to get back to even. Some of those investors are still clawing their way back.
Hopefully we don’t see any 80% losses any time soon in mass markets, but the 10-20% corrections are healthy and normal. It keeps investors in check and gives people an opportunity to buy low and to rebalance their portfolios.
So don’t fret! Make sure your portfolios are aligned with your goals and the time horizon you have for reaching your goals. That is really all you can control anyways. The rest will take care of itself.
Disclosures:
Any examples are hypothetical and for illustrative purposes only. Past performance is no predictor of future performance. Any investment involves potential losses, including total loss of principal. Consult with your financial advisor before making any investment decisions.
![]()